Example
These examples demonstrate how to use the Normalize operator.
The following example demonstrates the normalization of IBM stock prices and trading volumes:
use com.teracloud.streams.timeseries.analysis::Normalize;
composite Main {
  graph
    stream<list<float64> inp> RawStockStream = FileSource() {
      param
        file: "stockNormalize.csv";
        format: csv;
        initDelay: 1.0f;
    }

    stream<list<float64> normalizedStock> NormalizedStock = Normalize(RawStockStream) {
      param
        // Use the first 14 samples to estimate the means
        initSamples: 14u;
        inputTimeSeries: inp;
      output
        NormalizedStock:
          normalizedStock = normalizedTimeSeries();
    }
    () as SinkOP1 = FileSink(NormalizedStock) {
      param
        file: "stockNormal.csv";
        format: csv;
    }
}
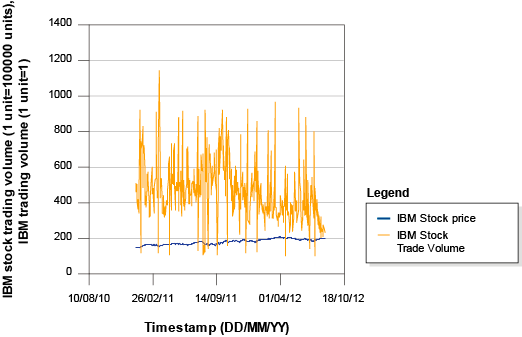
The first graph illustrates the input for the Normalize operator: stock prices and stock trade volumes. The range of values for the volume are much higher than the prices:

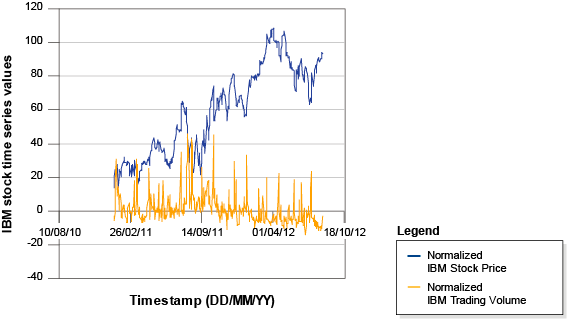
The second graph illustrates the normalized values for the stock price and stock trade volumes. The two time series are now within comparable range:

