Example
The following example forecasts electricity usage in the United States:
use com.teracloud.streams.timeseries.modeling::ARIMA2;
composite ARIMAMain {
  graph
    stream<float64 ts> data = FileSource() {
      param
        file: "elecUsage.csv";
    }

    stream<list<list<float64>> forecast> forecastedData = ARIMA2(data) {
      param
        inputTimeSeries: ts; // time series to be forecasted
        initSamples:60u;     // use early 60 samples to train the model
        AROrder:12u;         // use AR model of order 12
        stepAhead:1u;        // forecast one step ahead (horizon)
      output
        forecastedData: forecast = forecastedAllTimeSeriesSteps(); // return all forecasted value up to specified horizon
    }

    () as ForecastedOutput = FileSink(forecastedData) {
      param
        file:"ARIMAPrediction.csv"; // put result in a file
        format:csv;
    }
}
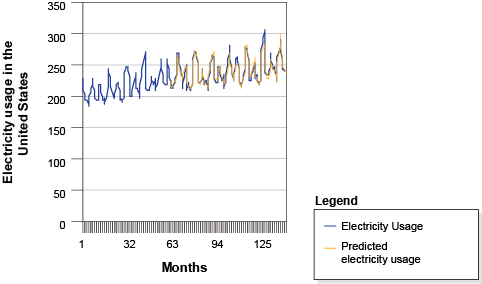
The following graph illustrates the actual electricity usage and the predicted electricity usage, which is generated by using the ARIMA operator:

